State confinement costs
This measure is designed to compare the costs to state taxpayers of each county's determination in handling its felony arrestees, both those sent to state facilities and those managed locally. Those counties that send a higher proportion of their felony arrestees to state facilities generate more state costs per felony arrestee than counties that handle higher proportions of their felon arrestees locally. The cost is expressed per 1,000 felony arrestees to produce more easily compared numbers.
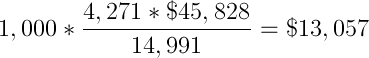
Note: the cost figure this measure generates is per 1,000 felony arrestees in each county, not per prisoner/ward.
The formula used to calculate this measure for each county is:

An equivalent formula is utilized to generate the juvenile metric.
Using Alameda County as an example, in 2010 the county had 4,271 adults in state prison at an average cost per prisoner of $45,828. The county reported 14,991 adult felony arrests that year. The calculation would be:
Again, this number shows the relative cost to state taxpayers imposed by each county's determination to use state facilities for its felony arrestees (as opposed to managing its felons locally).
County institutional capacity
These tables show the rated capacity of each county's juvenile detention facilities (juvenile halls + camps), the average daily population (ADP) in those facilities during the 4th quarter of the Calendar Year, and the number of beds that remained unoccupied ("space available"). The rated capacity is the number of beds that comply with standards set forth in Title 24, California Code of Regulations.
- 2009
- 2010
- 2011
- 2012
- 2013
- 2014
- 2015*
| County |
Rated capacity |
Detention population |
Space available |
| California |
13,653 |
9,563 |
4,090 |
| Alameda |
463 |
276 |
187 |
| Alpine |
n/a |
n/a |
n/a |
| Amador |
0 |
0 |
0 |
| Butte |
60 |
45 |
15 |
| Calaveras |
n/a |
n/a |
n/a |
| Colusa |
60 |
48 |
12 |
| Contra Costa |
290 |
264 |
26 |
| Del Norte |
62 |
31 |
31 |
| El Dorado |
80 |
62 |
18 |
| Fresno |
450 |
382 |
68 |
| Glenn |
22 |
16 |
6 |
| Humboldt |
44 |
40 |
4 |
| Imperial |
72 |
25 |
48 |
| Inyo |
14 |
10 |
4 |
| Kern |
473 |
361 |
112 |
| Kings |
95 |
71 |
24 |
| Lake |
40 |
18 |
22 |
| Lassen |
40 |
9 |
31 |
| Los Angeles |
4,144 |
2,906 |
1,238 |
| Madera |
119 |
57 |
62 |
| Marin |
40 |
19 |
21 |
| Mariposa |
4 |
0 |
4 |
| Mendocino |
43 |
25 |
18 |
| Merced |
120 |
101 |
19 |
| Modoc |
n/a |
n/a |
n/a |
| Mono |
4 |
0 |
4 |
| Monterey |
193 |
154 |
39 |
| Napa |
50 |
42 |
8 |
| Nevada |
30 |
18 |
12 |
| Orange |
797 |
617 |
180 |
| Placer |
55 |
37 |
18 |
| Plumas |
n/a |
n/a |
n/a |
| Riverside |
584 |
372 |
212 |
| Sacramento |
386 |
332 |
55 |
| San Benito |
20 |
18 |
2 |
| San Bernardino |
620 |
378 |
242 |
| San Diego |
1,105 |
809 |
296 |
| San Francisco |
234 |
104 |
130 |
| San Joaquin |
224 |
168 |
56 |
| San Luis Obispo |
45 |
42 |
3 |
| San Mateo |
274 |
206 |
68 |
| Santa Barbara |
272 |
189 |
83 |
| Santa Clara |
550 |
395 |
156 |
| Santa Cruz |
42 |
21 |
21 |
| Shasta |
56 |
32 |
24 |
| Sierra |
0 |
0 |
0 |
| Siskiyou |
20 |
9 |
11 |
| Solano |
148 |
110 |
38 |
| Sonoma |
148 |
108 |
40 |
| Stanislaus |
158 |
150 |
8 |
| Sutter |
n/a |
n/a |
n/a |
| Tehama |
40 |
22 |
18 |
| Trinity |
28 |
8 |
20 |
| Tulare |
345 |
156 |
189 |
| Tuolumne |
0 |
0 |
0 |
| Ventura |
280 |
179 |
101 |
| Yolo |
90 |
76 |
14 |
| Yuba |
120 |
47 |
73 |
| County |
Rated capacity |
Detention population |
Space available |
| California |
13,651 |
8,550 |
5,101 |
| Alameda |
463 |
278 |
185 |
| Alpine |
n/a |
n/a |
n/a |
| Amador |
0 |
1 |
-1 |
| Butte |
60 |
43 |
17 |
| Calaveras |
n/a |
n/a |
n/a |
| Colusa |
60 |
0 |
60 |
| Contra Costa |
290 |
273 |
17 |
| Del Norte |
62 |
33 |
29 |
| El Dorado |
80 |
62 |
18 |
| Fresno |
450 |
354 |
96 |
| Glenn |
22 |
18 |
4 |
| Humboldt |
44 |
35 |
9 |
| Imperial |
72 |
25 |
47 |
| Inyo |
14 |
9 |
5 |
| Kern |
475 |
386 |
89 |
| Kings |
209 |
98 |
111 |
| Lake |
40 |
10 |
30 |
| Lassen |
40 |
12 |
28 |
| Los Angeles |
4,144 |
2,367 |
1,777 |
| Madera |
75 |
44 |
31 |
| Marin |
40 |
23 |
17 |
| Mariposa |
4 |
0 |
4 |
| Mendocino |
43 |
18 |
25 |
| Merced |
120 |
94 |
26 |
| Modoc |
n/a |
n/a |
n/a |
| Mono |
4 |
0 |
4 |
| Monterey |
206 |
152 |
54 |
| Napa |
50 |
30 |
20 |
| Nevada |
30 |
14 |
16 |
| Orange |
797 |
547 |
250 |
| Placer |
58 |
50 |
8 |
| Plumas |
n/a |
n/a |
n/a |
| Riverside |
582 |
348 |
234 |
| Sacramento |
270 |
214 |
56 |
| San Benito |
20 |
11 |
9 |
| San Bernardino |
620 |
345 |
275 |
| San Diego |
1,105 |
760 |
345 |
| San Francisco |
234 |
115 |
119 |
| San Joaquin |
224 |
159 |
65 |
| San Luis Obispo |
45 |
37 |
8 |
| San Mateo |
274 |
159 |
115 |
| Santa Barbara |
272 |
162 |
110 |
| Santa Clara |
538 |
356 |
182 |
| Santa Cruz |
42 |
20 |
22 |
| Shasta |
56 |
29 |
27 |
| Sierra |
0 |
0 |
0 |
| Siskiyou |
20 |
16 |
4 |
| Solano |
148 |
117 |
31 |
| Sonoma |
188 |
111 |
77 |
| Stanislaus |
158 |
136 |
22 |
| Sutter |
n/a |
n/a |
n/a |
| Tehama |
40 |
18 |
22 |
| Trinity |
28 |
10 |
18 |
| Tulare |
330 |
186 |
144 |
| Tuolumne |
0 |
0 |
0 |
| Ventura |
295 |
169 |
126 |
| Yolo |
90 |
48 |
42 |
| Yuba |
120 |
48 |
72 |
| County |
Rated capacity |
Detention population |
Space available |
| California |
13,538 |
7,807 |
5,731 |
| Alameda |
463 |
283 |
180 |
| Alpine |
n/a |
n/a |
n/a |
| Amador |
0 |
0 |
0 |
| Butte |
60 |
51 |
9 |
| Calaveras |
n/a |
n/a |
n/a |
| Colusa |
0 |
0 |
0 |
| Contra Costa |
390 |
247 |
143 |
| Del Norte |
62 |
33 |
29 |
| El Dorado |
80 |
47 |
33 |
| Fresno |
450 |
331 |
119 |
| Glenn |
22 |
11 |
11 |
| Humboldt |
44 |
27 |
17 |
| Imperial |
72 |
18 |
54 |
| Inyo |
14 |
7 |
7 |
| Kern |
485 |
347 |
138 |
| Kings |
209 |
80 |
130 |
| Lake |
40 |
11 |
29 |
| Lassen |
40 |
13 |
27 |
| Los Angeles |
4,144 |
2,179 |
1,965 |
| Madera |
85 |
44 |
41 |
| Marin |
40 |
14 |
26 |
| Mariposa |
4 |
0 |
4 |
| Mendocino |
43 |
23 |
20 |
| Merced |
120 |
85 |
35 |
| Modoc |
n/a |
n/a |
n/a |
| Mono |
4 |
0 |
4 |
| Monterey |
190 |
152 |
38 |
| Napa |
50 |
26 |
24 |
| Nevada |
60 |
21 |
39 |
| Orange |
797 |
555 |
242 |
| Placer |
58 |
34 |
24 |
| Plumas |
n/a |
n/a |
n/a |
| Riverside |
582 |
281 |
301 |
| Sacramento |
270 |
155 |
115 |
| San Benito |
20 |
11 |
9 |
| San Bernardino |
420 |
364 |
56 |
| San Diego |
1,105 |
693 |
412 |
| San Francisco |
234 |
104 |
130 |
| San Joaquin |
224 |
149 |
75 |
| San Luis Obispo |
45 |
33 |
12 |
| San Mateo |
274 |
156 |
118 |
| Santa Barbara |
272 |
166 |
106 |
| Santa Clara |
538 |
242 |
296 |
| Santa Cruz |
42 |
21 |
21 |
| Shasta |
56 |
26 |
30 |
| Sierra |
0 |
0 |
0 |
| Siskiyou |
33 |
16 |
17 |
| Solano |
148 |
89 |
59 |
| Sonoma |
188 |
103 |
85 |
| Stanislaus |
158 |
130 |
28 |
| Sutter |
n/a |
n/a |
n/a |
| Tehama |
40 |
20 |
20 |
| Trinity |
28 |
7 |
21 |
| Tulare |
330 |
181 |
149 |
| Tuolumne |
0 |
0 |
0 |
| Ventura |
295 |
134 |
161 |
| Yolo |
90 |
38 |
52 |
| Yuba |
120 |
50 |
70 |
| County |
Rated capacity |
Detention population |
Space available |
| California |
13,160 |
7,080 |
6,080 |
| Alameda |
463 |
226 |
237 |
| Alpine |
n/a |
n/a |
n/a |
| Amador |
n/a |
n/a |
n/a |
| Butte |
60 |
50 |
10 |
| Calaveras |
n/a |
n/a |
n/a |
| Colusa |
n/a |
n/a |
n/a |
| Contra Costa |
390 |
224 |
166 |
| Del Norte |
62 |
37 |
25 |
| El Dorado |
80 |
43 |
37 |
| Fresno |
450 |
302 |
148 |
| Glenn |
22 |
14 |
9 |
| Humboldt |
44 |
33 |
12 |
| Imperial |
72 |
12 |
61 |
| Inyo |
14 |
5 |
9 |
| Kern |
475 |
355 |
120 |
| Kings |
205 |
69 |
136 |
| Lake |
30 |
18 |
12 |
| Lassen |
40 |
10 |
30 |
| Los Angeles |
3,573 |
1,937 |
1,636 |
| Madera |
70 |
54 |
16 |
| Marin |
40 |
12 |
28 |
| Mariposa |
4 |
0 |
4 |
| Mendocino |
43 |
21 |
22 |
| Merced |
120 |
64 |
56 |
| Modoc |
n/a |
n/a |
n/a |
| Mono |
4 |
0 |
4 |
| Monterey |
190 |
122 |
68 |
| Napa |
50 |
24 |
26 |
| Nevada |
60 |
18 |
42 |
| Orange |
743 |
457 |
286 |
| Placer |
65 |
25 |
40 |
| Plumas |
n/a |
n/a |
n/a |
| Riverside |
582 |
278 |
305 |
| Sacramento |
444 |
176 |
268 |
| San Benito |
20 |
9 |
11 |
| San Bernardino |
450 |
290 |
160 |
| San Diego |
1,105 |
695 |
410 |
| San Francisco |
234 |
96 |
138 |
| San Joaquin |
224 |
134 |
90 |
| San Luis Obispo |
45 |
43 |
2 |
| San Mateo |
245 |
128 |
117 |
| Santa Barbara |
272 |
147 |
125 |
| Santa Clara |
538 |
233 |
305 |
| Santa Cruz |
42 |
20 |
22 |
| Shasta |
56 |
31 |
25 |
| Sierra |
0 |
0 |
0 |
| Siskiyou |
40 |
15 |
25 |
| Solano |
148 |
88 |
60 |
| Sonoma |
188 |
96 |
92 |
| Stanislaus |
158 |
115 |
43 |
| Sutter |
n/a |
n/a |
n/a |
| Tehama |
47 |
13 |
34 |
| Trinity |
28 |
7 |
21 |
| Tulare |
330 |
150 |
180 |
| Tuolumne |
0 |
0 |
0 |
| Ventura |
385 |
115 |
270 |
| Yolo |
90 |
21 |
69 |
| Yuba |
120 |
51 |
69 |
| County |
Rated capacity |
Detention population |
Space available |
| California |
13,035 |
7,591 |
5,444 |
| Alameda |
463 |
188 |
275 |
| Alpine |
0 |
0 |
n/a |
| Amador |
0 |
0 |
n/a |
| Butte |
60 |
33 |
27 |
| Calaveras |
0 |
0 |
n/a |
| Colusa |
0 |
0 |
n/a |
| Contra Costa |
390 |
225 |
165 |
| Del Norte |
62 |
25 |
37 |
| El Dorado |
80 |
40 |
40 |
| Fresno |
450 |
415 |
35 |
| Glenn |
22 |
17 |
5 |
| Humboldt |
44 |
32 |
12 |
| Imperial |
72 |
16 |
56 |
| Inyo |
14 |
5 |
9 |
| Kern |
485 |
331 |
154 |
| Kings |
85 |
48 |
37 |
| Lake |
30 |
22 |
8 |
| Lassen |
40 |
10 |
30 |
| Los Angeles |
3678 |
2126 |
1,552 |
| Madera |
70 |
66 |
4 |
| Marin |
40 |
11 |
29 |
| Mariposa |
4 |
3 |
1 |
| Mendocino |
43 |
16 |
27 |
| Merced |
120 |
133 |
-13 |
| Modoc |
0 |
0 |
n/a |
| Mono |
4 |
0 |
4 |
| Monterey |
190 |
143 |
47 |
| Napa |
50 |
23 |
27 |
| Nevada |
60 |
26 |
34 |
| Orange |
743 |
463 |
280 |
| Placer |
78 |
18 |
60 |
| Plumas |
0 |
0 |
n/a |
| Riverside |
538 |
278 |
260 |
| Sacramento |
444 |
295 |
149 |
| San Benito |
20 |
13 |
7 |
| San Bernardino |
450 |
254 |
196 |
| San Diego |
1105 |
680 |
425 |
| San Francisco |
165 |
68 |
97 |
| San Joaquin |
224 |
102 |
122 |
| San Luis Obispo |
45 |
17 |
28 |
| San Mateo |
245 |
188 |
57 |
| Santa Barbara |
232 |
103 |
129 |
| Santa Clara |
474 |
327 |
147 |
| Santa Cruz |
42 |
14 |
28 |
| Shasta |
56 |
47 |
9 |
| Sierra |
0 |
0 |
0 |
| Siskiyou |
40 |
9 |
31 |
| Solano |
148 |
86 |
62 |
| Sonoma |
164 |
125 |
39 |
| Stanislaus |
218 |
129 |
89 |
| Sutter |
0 |
0 |
n/a |
| Tehama |
60 |
10 |
50 |
| Trinity |
28 |
6 |
22 |
| Tulare |
330 |
215 |
115 |
| Tuolumne |
0 |
0 |
0 |
| Ventura |
420 |
91 |
329 |
| Yolo |
90 |
52 |
38 |
| Yuba |
120 |
47 |
73 |
| County |
Rated capacity |
Detention population |
Space available |
| California |
12,992 |
6,565 |
6,427 |
| Alameda |
463 |
177 |
286 |
| Alpine |
0 |
0 |
n/a |
| Amador |
0 |
0 |
n/a |
| Butte |
120 |
30 |
90 |
| Calaveras |
0 |
0 |
n/a |
| Colusa |
0 |
0 |
n/a |
| Contra Costa |
390 |
209 |
181 |
| Del Norte |
62 |
28 |
34 |
| El Dorado |
80 |
25 |
55 |
| Fresno |
450 |
407 |
43 |
| Glenn |
22 |
11 |
11 |
| Humboldt |
44 |
26 |
18 |
| Imperial |
72 |
10 |
62 |
| Inyo |
14 |
5 |
9 |
| Kern |
485 |
313 |
172 |
| Kings |
85 |
64 |
21 |
| Lake |
30 |
21 |
9 |
| Lassen |
40 |
14 |
26 |
| Los Angeles |
3554 |
1696 |
1,858 |
| Madera |
70 |
59 |
11 |
| Marin |
40 |
16 |
24 |
| Mariposa |
4 |
0 |
4 |
| Mendocino |
43 |
11 |
32 |
| Merced |
120 |
60 |
60 |
| Modoc |
0 |
0 |
n/a |
| Mono |
0 |
0 |
0 |
| Monterey |
190 |
112 |
78 |
| Napa |
50 |
13 |
37 |
| Nevada |
60 |
19 |
41 |
| Orange |
743 |
351 |
392 |
| Placer |
78 |
22 |
56 |
| Plumas |
0 |
0 |
n/a |
| Riverside |
466 |
217 |
249 |
| Sacramento |
444 |
291 |
153 |
| San Benito |
20 |
10 |
10 |
| San Bernardino |
450 |
279 |
171 |
| San Diego |
1105 |
563 |
542 |
| San Francisco |
234 |
77 |
157 |
| San Joaquin |
224 |
115 |
109 |
| San Luis Obispo |
45 |
23 |
22 |
| San Mateo |
245 |
177 |
68 |
| Santa Barbara |
232 |
84 |
148 |
| Santa Clara |
474 |
233 |
241 |
| Santa Cruz |
42 |
15 |
27 |
| Shasta |
90 |
36 |
54 |
| Sierra |
0 |
0 |
0 |
| Siskiyou |
40 |
14 |
26 |
| Solano |
148 |
66 |
82 |
| Sonoma |
164 |
112 |
52 |
| Stanislaus |
218 |
113 |
105 |
| Sutter |
0 |
0 |
n/a |
| Tehama |
60 |
17 |
43 |
| Trinity |
22 |
0 |
22 |
| Tulare |
330 |
250 |
80 |
| Tuolumne |
0 |
0 |
0 |
| Ventura |
420 |
70 |
350 |
| Yolo |
90 |
53 |
37 |
| Yuba |
120 |
51 |
69 |
| County |
Rated capacity |
Detention population |
Space available |
| California |
13,007 |
6,926 |
6,081 |
| Alameda |
463 |
180 |
283 |
| Alpine |
0 |
0 |
n/a |
| Amador |
0 |
0 |
n/a |
| Butte |
120 |
31 |
89 |
| Calaveras |
0 |
0 |
n/a |
| Colusa |
0 |
0 |
n/a |
| Contra Costa |
390 |
207 |
183 |
| Del Norte |
62 |
33 |
29 |
| El Dorado |
80 |
31 |
49 |
| Fresno |
450 |
390 |
60 |
| Glenn |
22 |
8 |
14 |
| Humboldt |
44 |
31 |
13 |
| Imperial |
72 |
19 |
53 |
| Inyo |
14 |
4 |
10 |
| Kern |
485 |
324 |
161 |
| Kings |
85 |
68 |
17 |
| Lake |
30 |
17 |
13 |
| Lassen |
40 |
12 |
28 |
| Los Angeles |
3554 |
1786 |
1,768 |
| Madera |
70 |
63 |
7 |
| Marin |
40 |
23 |
17 |
| Mariposa |
4 |
0 |
4 |
| Mendocino |
43 |
7 |
36 |
| Merced |
120 |
99 |
21 |
| Modoc |
0 |
0 |
n/a |
| Mono |
0 |
0 |
0 |
| Monterey |
190 |
127 |
63 |
| Napa |
50 |
18 |
32 |
| Nevada |
60 |
20 |
40 |
| Orange |
743 |
382 |
361 |
| Placer |
78 |
20 |
58 |
| Plumas |
0 |
0 |
n/a |
| Riverside |
466 |
217 |
249 |
| Sacramento |
444 |
333 |
111 |
| San Benito |
20 |
18 |
2 |
| San Bernardino |
450 |
269 |
181 |
| San Diego |
1105 |
595 |
510 |
| San Francisco |
234 |
74 |
160 |
| San Joaquin |
224 |
118 |
106 |
| San Luis Obispo |
45 |
27 |
18 |
| San Mateo |
260 |
182 |
78 |
| Santa Barbara |
232 |
95 |
137 |
| Santa Clara |
474 |
267 |
207 |
| Santa Cruz |
42 |
20 |
22 |
| Shasta |
90 |
30 |
60 |
| Sierra |
0 |
0 |
0 |
| Siskiyou |
40 |
11 |
29 |
| Solano |
148 |
78 |
70 |
| Sonoma |
164 |
116 |
48 |
| Stanislaus |
218 |
121 |
97 |
| Sutter |
0 |
0 |
n/a |
| Tehama |
60 |
21 |
39 |
| Trinity |
22 |
0 |
22 |
| Tulare |
330 |
237 |
93 |
| Tuolumne |
0 |
0 |
0 |
| Ventura |
420 |
88 |
332 |
| Yolo |
90 |
52 |
38 |
| Yuba |
120 |
57 |
63 |
*As of March 31